Dashboard
Calm on-chain analytics
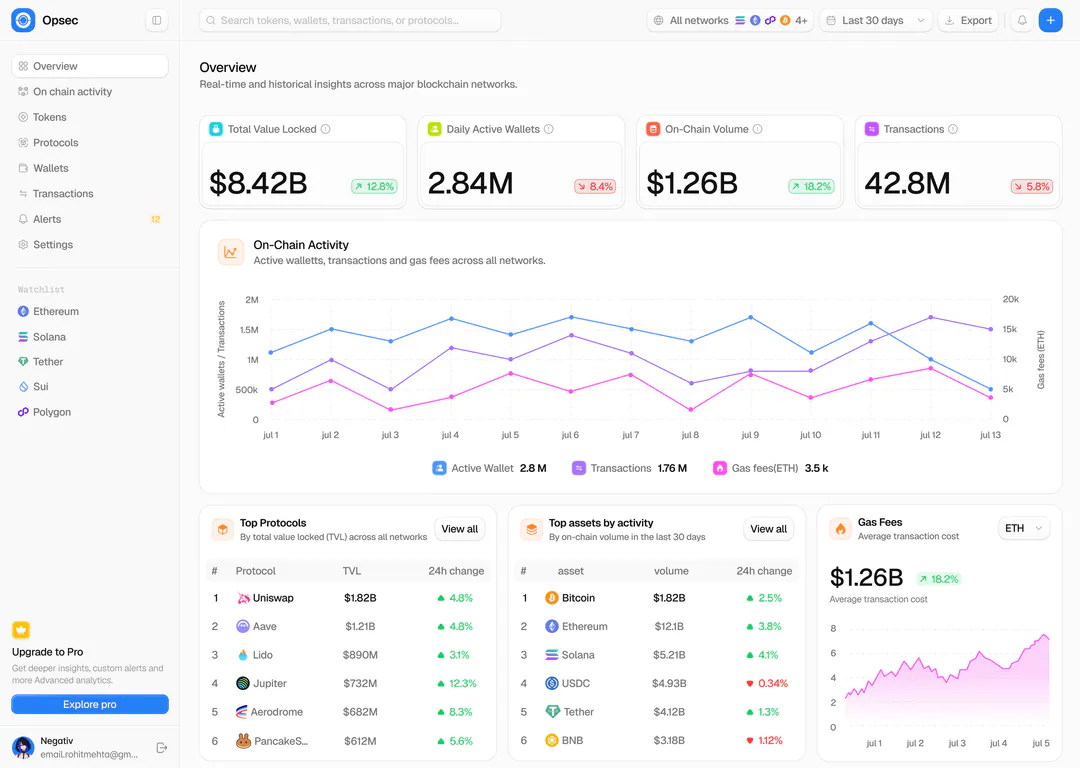
Opsec is a blockchain analytics dashboard I designed. The overview brings value locked, active wallets, volume and transactions across networks into one calm, light screen.
OriginalOverview
- What it’s for
- A real-time picture of activity across major blockchains: value locked, wallets, volume, transactions and gas, plus the protocols and assets driving them.
- Who uses it
- Analysts and traders who need the state of the market across several chains before digging into a single protocol or token.
Close-ups
01/03Label above, value inside
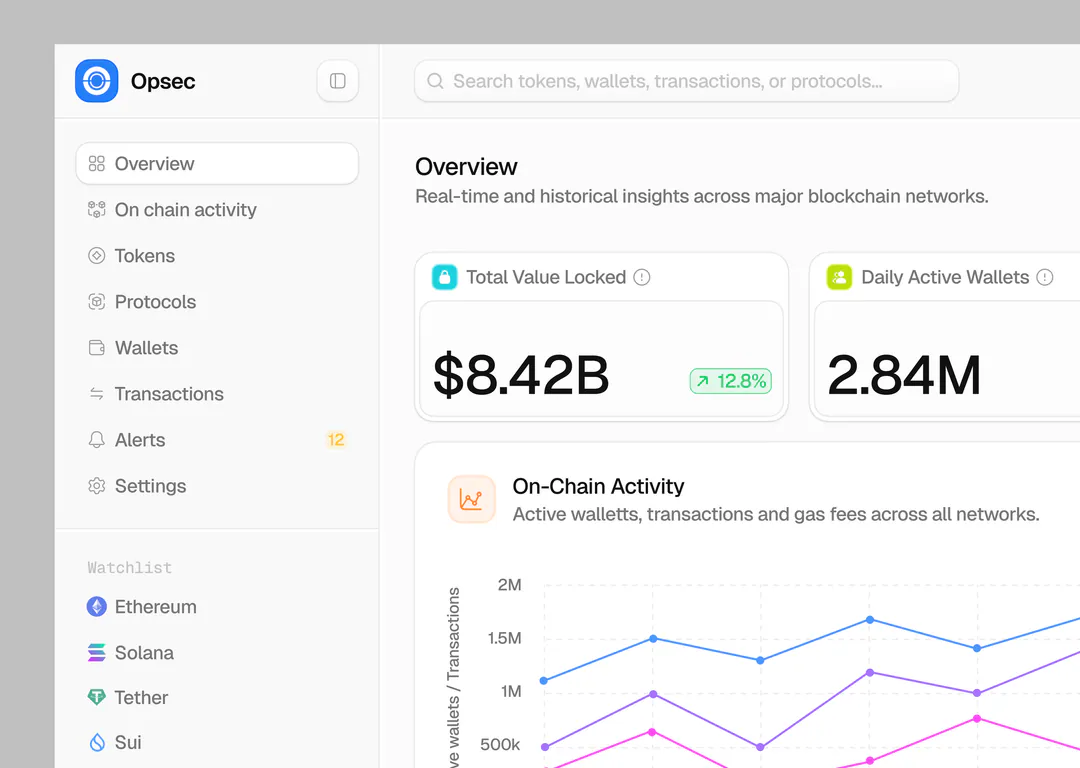
Each KPI card has a label row with an icon and an info tooltip, and an inset panel for the number and its change, so the label and the value never blur together. The chart legend pairs each line’s colour with its current value.
02/03Rankings with a direction you can see
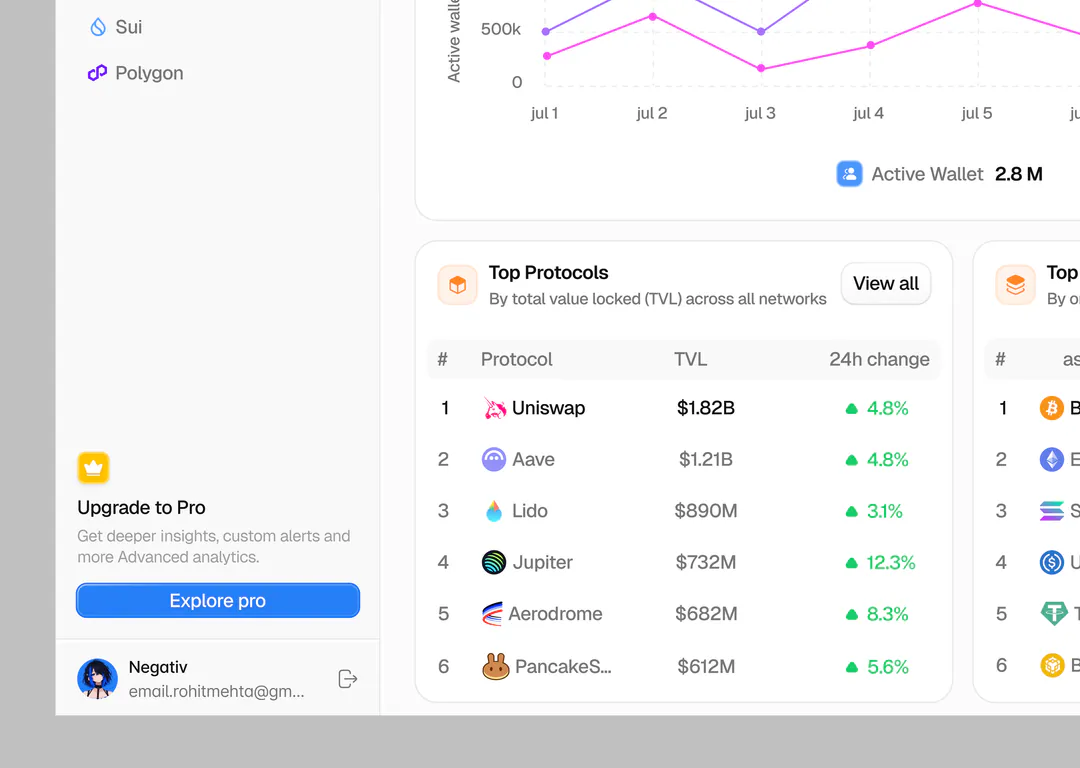
Top Protocols is numbered, so it reads as a ranking. Every change has a triangle as well as a colour, which keeps up and down clear for colour-blind users.
03/03Every panel names its scope
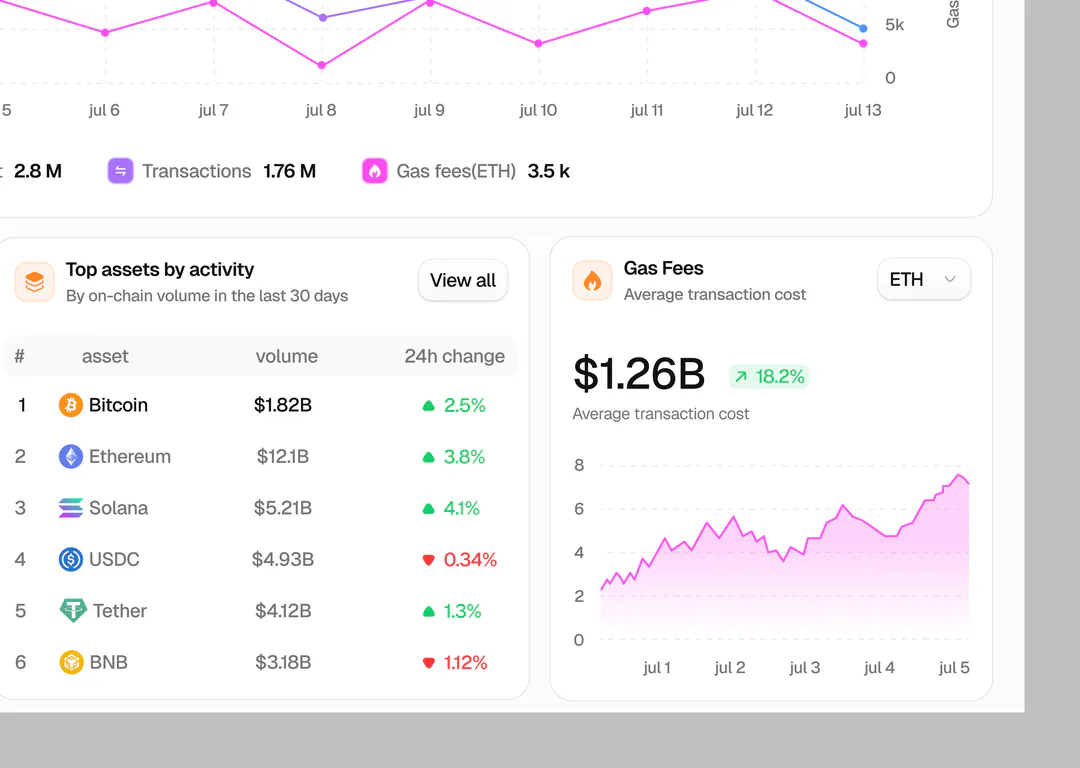
Each title has a one-line subtitle, such as “By on-chain volume in the last 30 days”, so a number is never shown without its timeframe. The gas panel gets its own network selector instead of following the global filter.
What I’d test next
- 01Dual-axis charts are easy to misread: test gas fees as its own small chart.
- 02Whether the global “Last 30 days” filter is noticed when panels carry their own scopes.
- 03Which sidebar watchlist chains people pin, to decide the defaults.